A nice tutorial on creating typological maps in R by Kilu von Prince.
A couple more links that might be of interest, via the article:
A nice tutorial on creating typological maps in R by Kilu von Prince.
A couple more links that might be of interest, via the article:
Nice! Thanks for this.
One thing that came up recently with mapping for the Oxford Australian volume was the output of many off the shelf mapping tools that linguists used either don’t have the resolution for printed volumes, or have default colour schemes that don’t transfer well to black and white/greyscale printing. Moreover, they redefine variables in a way that makes using the R options for symbols not straightforward (e.g. they introduce a default sort ordering as part of the mapping function that can’t be overridden, or if you use symbols instead of their colour defaults, you can no longer also sort by frequency). We ended up redrawing a bunch of these maps in QGIS.
Thanks for sharing! Last map I made I used this Python package (which I can barely remember at this point, except that it didn’t take too long to figure out): LingTypology: Documentation — LingTypology 0.8.6 documentation
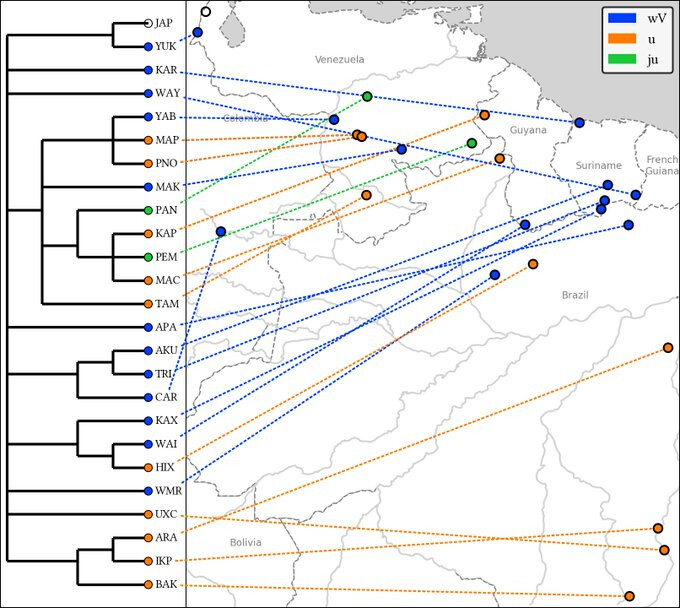
I haven’t tried this yet, but @fmatter has a more complex mapping code that links geography with language family trees: GitHub - fmatter/lingtreemaps: Plot data on linguistic trees and maps.
Disclaimer about lingtreemaps: whether you can make a good-looking map really depends on the shape of the tree and the geographic distribution of the languages in your sample. There’s a couple more examples in the documentation (lingtreemaps.readthedocs.io/). It is best suited for smaller families, obviously.
If you have trouble using it, best way is to open a github issue (alternatively, contact me in private).
If you use it to make a cool map, please let me know and I’ll add it to the example gallery ![]()
Nice tutorial. It might be worth mentioning that the toy dataset used in it is very close to a “metadata free” CLDF StructureDataset. In fact, starting with just
Language,Word order
Movima,0
Arapaho,OV
Alta,OV
Savosavo,OV
Teop,VO
Sumi,VO
Yali,OV
Beja,VO
Vera'a,OV
Cabecar,VO
we could add a column Parameter_ID
csvstack -n Parameter_ID -g Word_order typology.csv
and pull in glottocodes from glottolog-cldf:
csvstack -n Parameter_ID -g Word_order typology.csv | csvjoin -c Language,Name - glottolog-cldf/cldf/languages.csv | csvcut -c"Language,Word order,ID,Parameter_ID"
Language,Word order,ID,Parameter_ID
Movima,0,movi1243,Word_order
Arapaho,OV,arap1274,Word_order
Savosavo,OV,savo1255,Word_order
Teop,VO,teop1238,Word_order
Beja,VO,beja1238,Word_order
then do a bit of renaming:
ID,Value,Language_ID,Parameter_ID
Movima,0,movi1243,Word_order
Arapaho,OV,arap1274,Word_order
save to a file values.csv et voilà:
$ cldf validate values.csv
WARNING values.csv:7:1 ID: invalid lexical value for string: Vera'a
(almost).
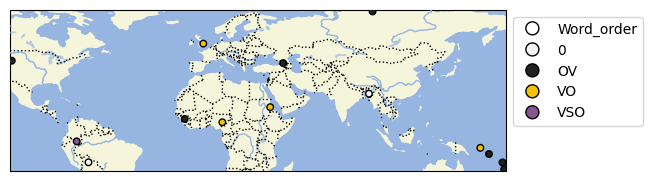
After fixing this, we could plot a very similar map using cldfviz.map:
cldfbench cldfviz.map values.csv --parameters Word_order --glottolog glottolog --markersize 15 --output map.png --format png
Regarding the R packages lingtypR and lingtypology: I understand the desire to make the user’s life easy by bundling data with the packages. (In fact, I’ve been asked to do that multiple times for a couple of packages I maintain.) But I think it is counterproductive.
From my perspective, CLDF could be a big part of the solution to this issue:
To be honest, I’m a bit puzzled that there is not more uptake of this idea ![]() Ideally, it shouldn’t be the case that each update of a dataset must trigger updates of packages using the data (e.g. updat Glottolog to 4/7e · ropensci/lingtypology@7777c73 · GitHub).
Ideally, it shouldn’t be the case that each update of a dataset must trigger updates of packages using the data (e.g. updat Glottolog to 4/7e · ropensci/lingtypology@7777c73 · GitHub).
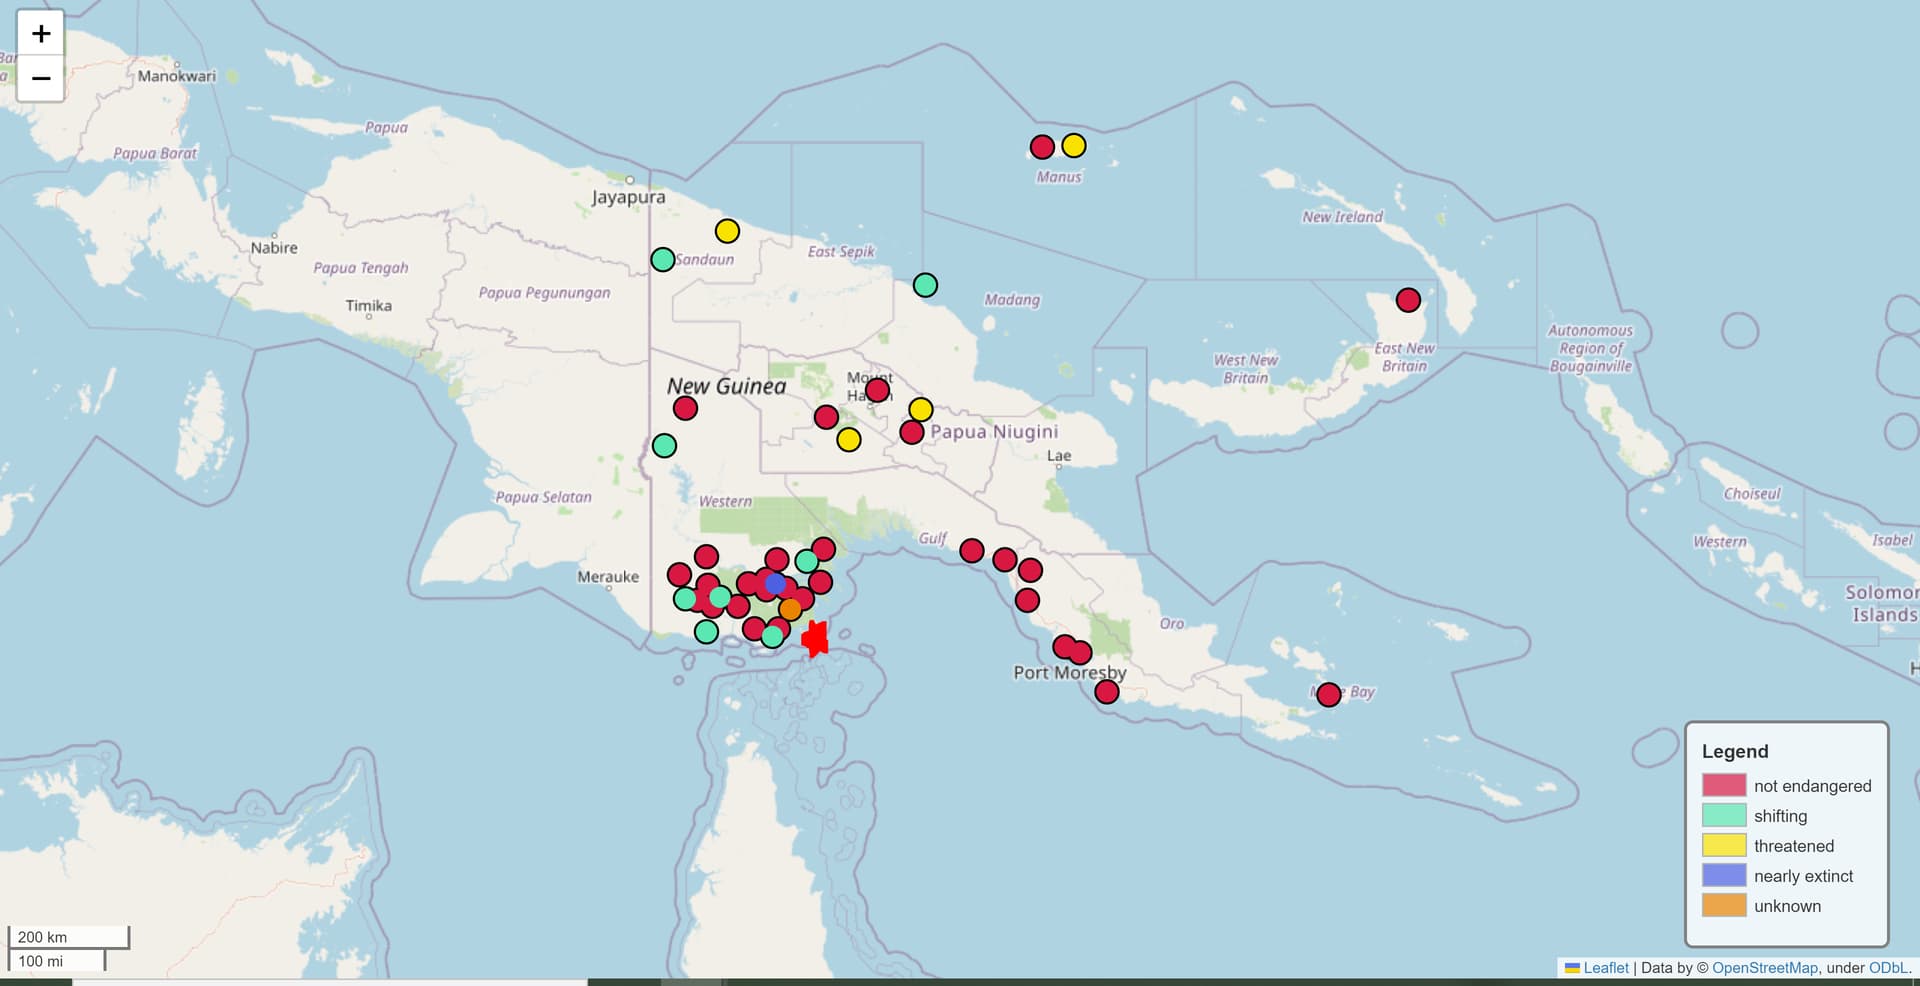
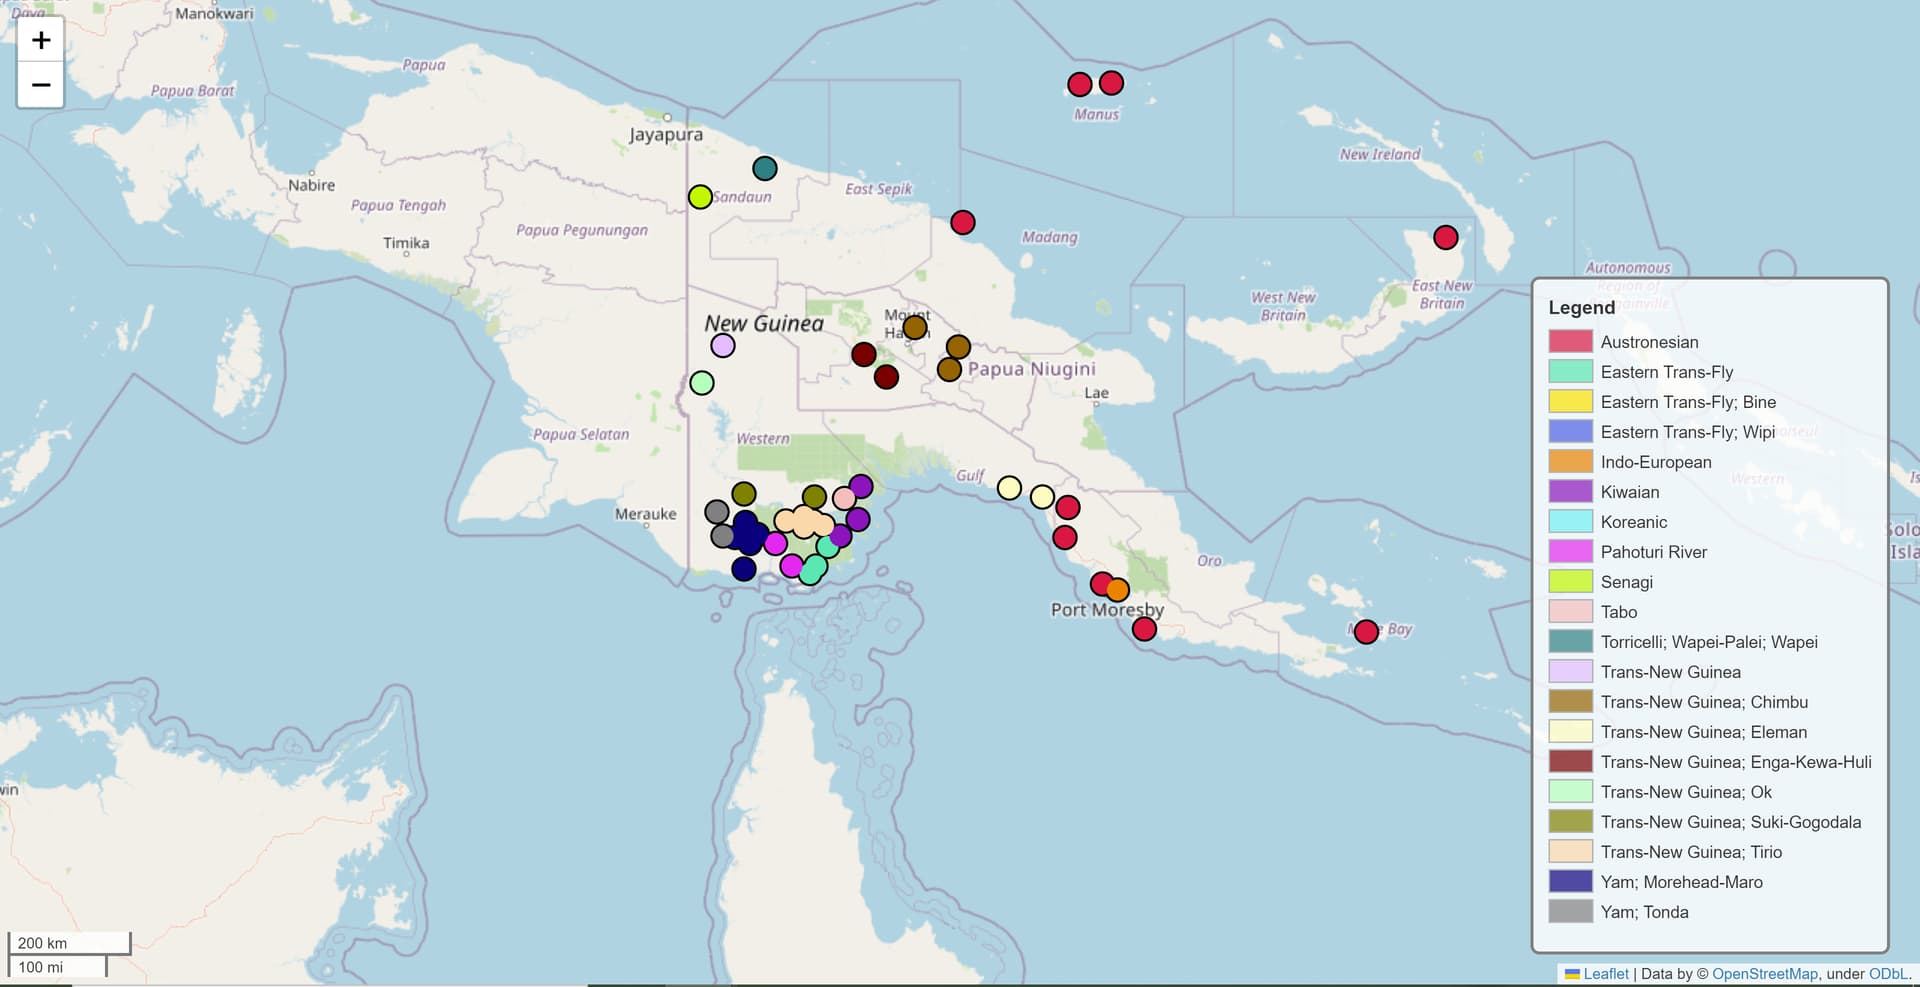
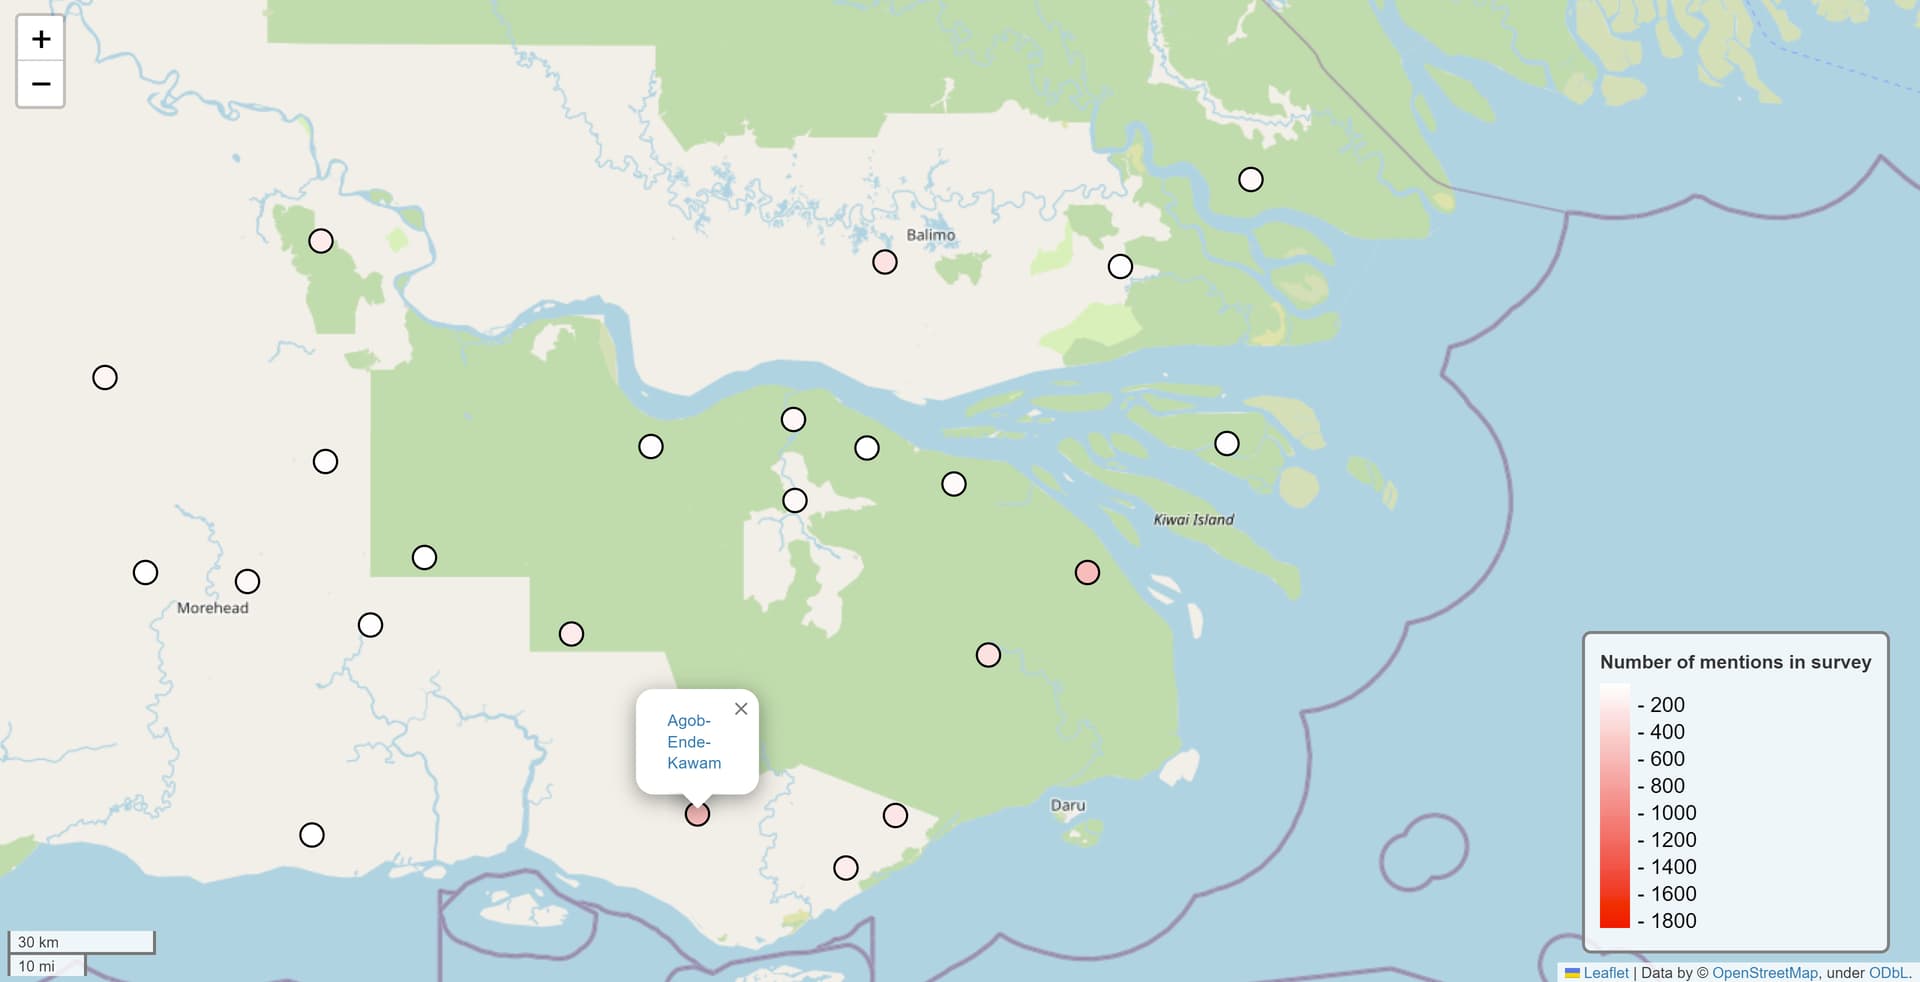
I had some fun today playing with the Python package that @joeylovestrand suggested! I was able to make some pretty informative graphs detailing the endangerment levels, family affliations, and number of mentions of about 59 languages spoken at a single high school in Daru, Papua New Guinea.
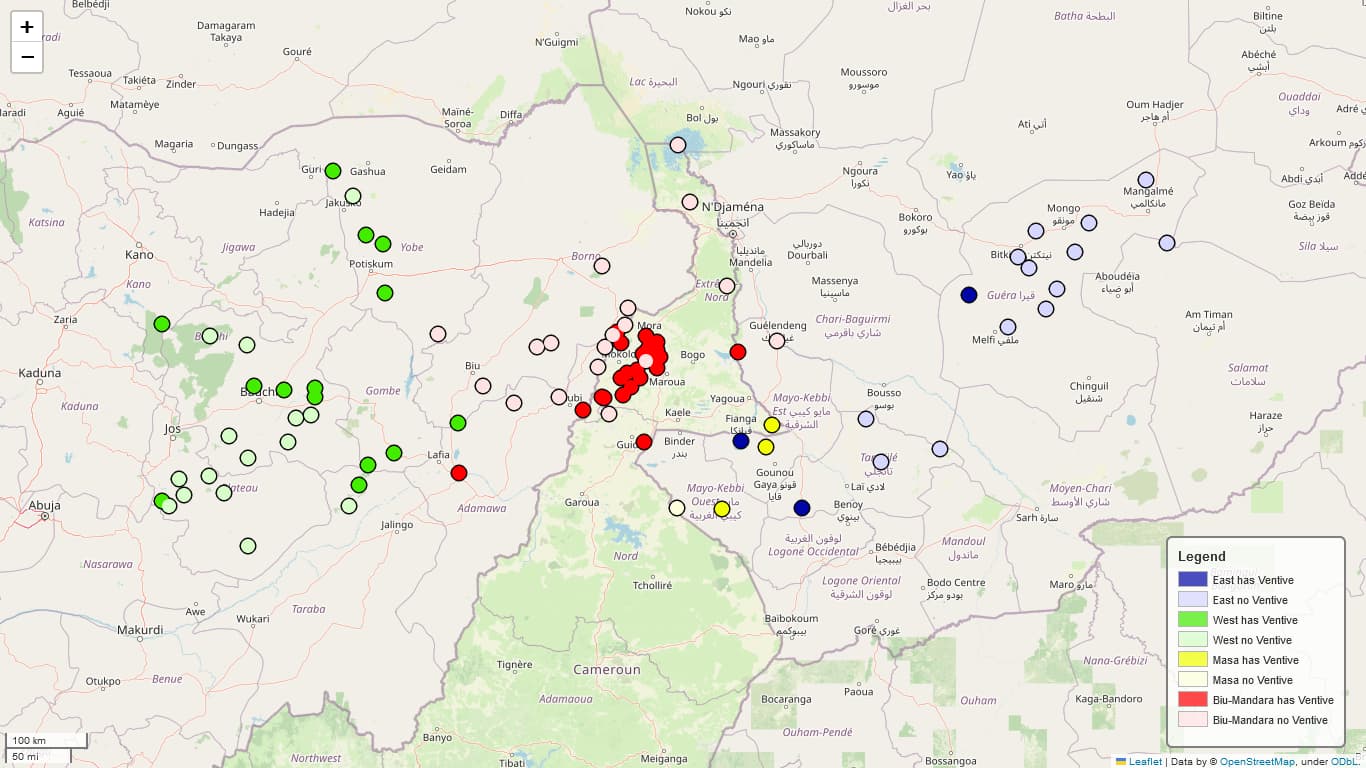
Nice maps! I’ve been playing around with this again myself, trying to figure out the best way to show both sub-classifications of a family and their value for a particular feature.
I started with making each combination a separate category and manually coding for colors that differ in saturation. This looks great but it’s not very clear for many people.
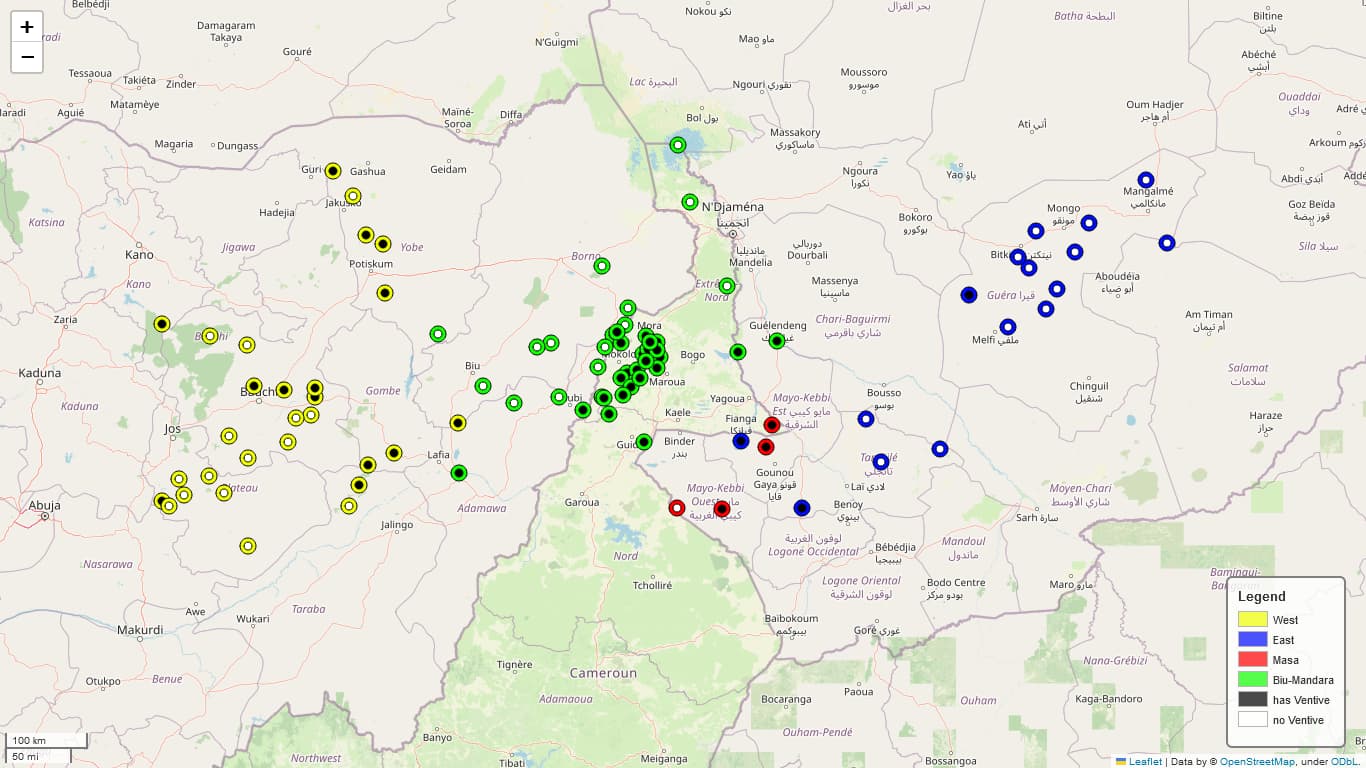
So I’ve also tried using overlays of black and white dots on color, which I don’t think is as pretty, but may be easier to read.
That’s why I added “shapes as pseudo-colormaps” in cldfviz.
So, a full example with cldfviz would look as follows. The main part is creating a suitable CLDF dataset - which (as in @joeylovestrand 's example) codes subgroup as second parameter:
import collections

from csvw.dsv import UnicodeWriter
from pycldf import Dataset

# Glottolog as CLDF dataset from https://doi.org/10.5281/zenodo.7398887
glottolog = Dataset.from_metadata('../glottolog/glottolog-cldf/cldf/cldf-metadata.json')
# World Atlas of Classifier Languages from https://doi.org/10.5281/zenodo.7322688
wacl = Dataset.from_metadata('../wacl/wacl-cldf/cldf/StructureDataset-metadata.json')

# We collect Chadic languages grouped into the 4 chadic subgroups:
chadic_by_subfamily = collections.defaultdict(list)
for lang in glottolog['ValueTable']:
    if lang['Parameter_ID'] == 'classification' and 'chad1250' in lang['Value']:
        # A Chadic languoid.
        # The Value column is coded as specified in `parameters.csv`:
        # > Path from root of family to the languoid as slash-separated list of Glottocodes.
        lineage = lang['Value'].split('/')
        findex = lineage.index('chad1250')
        if len(lineage) > findex + 1:
            chadic_by_subfamily[lineage[findex + 1]].append(lang['Language_ID'])

wacl_values = {v['Language_ID']: v['Value'] for v in wacl['ValueTable']}

i = 0
# We write a "metadata free" CLDF dataset (see https://github.com/cldf/cldf#metadata-free-conformance)
with UnicodeWriter('values.csv') as w:
    w.writerow(['ID', 'Language_ID', 'Parameter_ID', 'Value'])
    for sf, langs in chadic_by_subfamily.items():
        for gc in langs:
            if gc in wacl_values:  # A Chadic language in WACL.
                i += 1
                w.writerow([str(i), gc, 'subgroup', sf])
                i += 1
                w.writerow([str(i), gc, 'wacl', wacl_values[gc]])
(While this may look overly lengthy, I hope it becomes clear that being able to access data in different datasets uniformly helps a lot.)
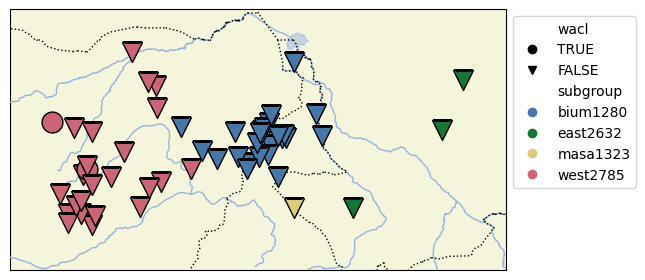
Then we can use shapes to display different feature values and colors for subgroups:
cldfbench cldfviz.map values.csv --parameters wacl,subgroup --colormaps '{"TRUE": "circle", "FALSE": "triangle_up"},tol' --glottolog ~/projects/glottolog/glottolog --markersize 15
This will create an HTML map (see
map.html (41.7 KB)
) looking roughly like the PNG map created with the added option --format png:
This is great, thanks!
As far as I could tell, Lingtypology (for Python) only allowed shapes in black & white.
My database is in a CLDF-ish format, so it may be worth polishing it up and figuring out cldfviz to get this flexibility with the maps
If you go for a full CLDF dataset (i.e. including language metadata, etc.), you’d also have control over the coordinates and language labels. In the example above, coordinates are taken from Glottolog (as is done in lingtypology, I think).
Not really a “cool map”, but a way to use lingtreemaps if you already have CLDF data is provided now in cldfviz.treemap.
I’ve tried to recreate your minimal example of cldfviz.map but am getting a vague syntax error. I can only assume it’s because I’m not linking to the Glottolog data correctly, but have tried a few ways and not been successful
(btw seems to be a type in the title here)
Could you send the full error output my way? I just tried in a fresh virtualenv:
pip install cldfviz
echo "ID,Language_ID,Parameter_ID,Value
1,stan1295,romance,false
2,stan1290,romance,true
3,ital1282,romance,true" > values.csv
cldfbench cldfviz.map values.csv --parameters romance --glottolog-cldf https://raw.githubusercontent.com/glottolog/glottolog-cldf/v4.7/cldf/cldf-metadata.json
and all went well.
@xrotwng Can I use geojson shapes in these maps? I have some JSON shapes for legal jurisdictions that I am trying to match with language activities. I’m wondering how useful it would be to use CLLD tools to build this. I do want interactive features. I’ve only ever seen these python maps and R maps which get published by linguists to have point based cartographic overlays. I want boxes or shapes. My preference is to use geojson.
Any thoughts or pointers?
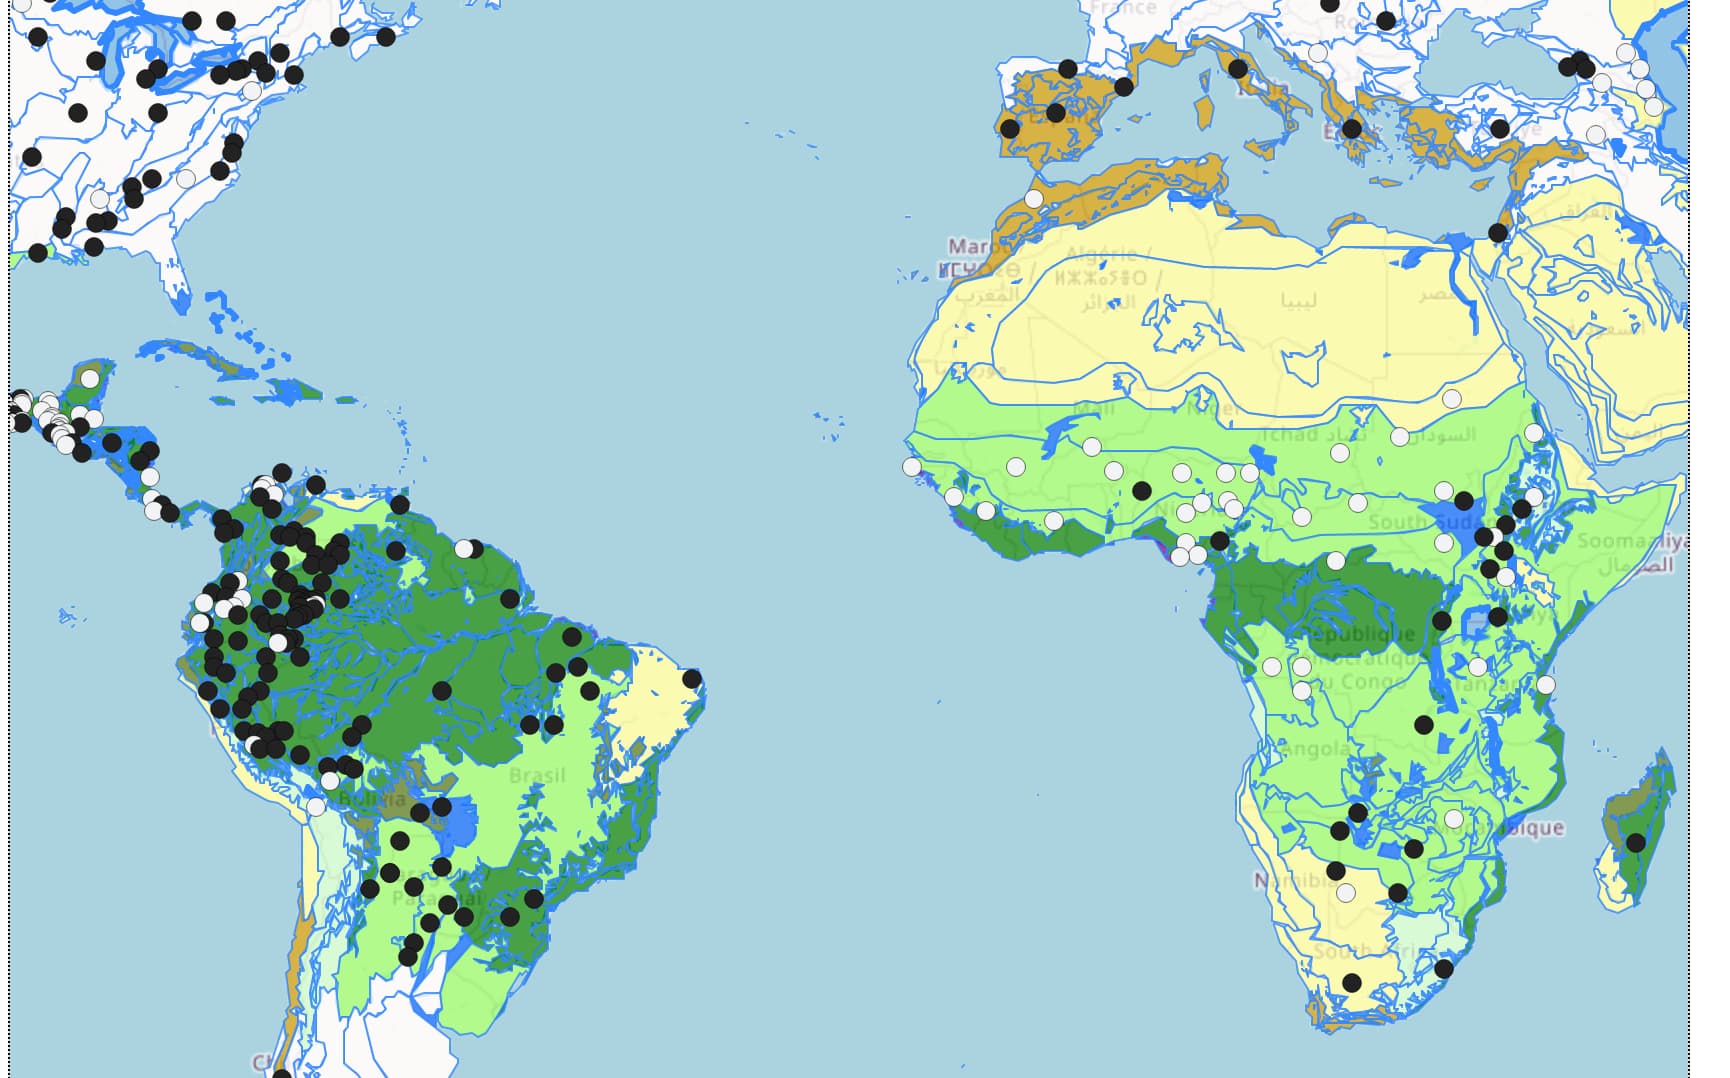
The HTML maps created by cldfviz.map can easily be modified (by hand or programmatically) to add GeoJSON layers. E.g. to add EcoRegions, as GeoJSON overlay, you’d
var ecoregions = at the beginning of your GeoJSON filecldfviz.map:--- map_orig.html 2023-02-04 09:18:20.409048859 +0100
+++ map.html 2023-02-04 09:51:33.844685145 +0100
@@ -14,6 +14,7 @@
<script src='https://api.mapbox.com/mapbox.js/plugins/leaflet-fullscreen/v1.0.1/Leaflet.fullscreen.min.js'></script>
<link href='https://api.mapbox.com/mapbox.js/plugins/leaflet-fullscreen/v1.0.1/leaflet.fullscreen.css'
rel='stylesheet'/>
+ <script src='ecoregions.json'></script>
<style>
body {
font-family: Verdana, Arial, Helvetica, sans-serif;
@@ -120,6 +121,29 @@
markers[i].openTooltip();
}
}
+ L.geoJSON(
+ ecoregions["features"],
+ {
+ style: function(feature) {
+ switch (feature.properties.BIOME | 0) {
+ case 1: return {fillColor: '#008001', weight: 1, opacity: 0.8, fillOpacity: 0.7};
+ case 2: return {fillColor: '#557715', weight: 1, opacity: 0.8, fillOpacity: 0.7};
+ case 3: return {fillColor: '#ffffff'};
+ case 4: return {fillColor: '#ffffff', weight: 1, opacity: 0.8, fillOpacity: 0.7};
+ case 5: return {fillColor: '#ffffff', weight: 1, opacity: 0.8, fillOpacity: 0.7};
+ case 6: return {fillColor: '#ffffff', weight: 1, opacity: 0.8, fillOpacity: 0.7};
+ case 7: return {fillColor: '#98ff66', weight: 1, opacity: 0.8, fillOpacity: 0.7};
+ case 8: return {fillColor: '#ffffff', weight: 1, opacity: 0.8, fillOpacity: 0.7};
+ case 9: return {fillColor: '#0265fe', weight: 1, opacity: 0.8, fillOpacity: 0.7};
+ case 10: return {fillColor: '#cdffcc', weight: 1, opacity: 0.8, fillOpacity: 0.7};
+ case 11: return {fillColor: '#ffffff', weight: 1, opacity: 0.8, fillOpacity: 0.7};
+ case 12: return {fillColor: '#cc9900', weight: 1, opacity: 0.8, fillOpacity: 0.7};
+ case 13: return {fillColor: '#feff99', weight: 1, opacity: 0.8, fillOpacity: 0.7};
+ case 14: return {fillColor: '#870083', weight: 1, opacity: 0.8, fillOpacity: 0.7};
+ }
+ }
+ }
+ ).addTo(map);
</script>
</body>
</html>
resulting in something like
Since the result looks so nice, I made a note to add such functionality to cldfviz.map Allow specification of custom GeoJSON overlays for HTML maps · Issue #45 · cldf/cldfviz · GitHub ![]()