Welp, I shall blather into the silence ![]()
So that paradigmatic data from yesterday looked like this:
form,gender,stem,case,number,frequency
o,masculine,a,nominative,singular,normal
e,masculine,a,nominative,singular,normal
aṃ,neuter,a,nominative,singular,normal
e,neuter,a,nominative,singular,normal
ā,feminine,ā,nominative,singular,normal
i,masculine,i,nominative,singular,normal
iṃ,neuter,i,nominative,singular,normal
i,neuter,i,nominative,singular,normal
ī,masculine,ī/in,nominative,singular,normal
I did find something interesting that’s almost what I think would help us with generating tables from such data (but not quite).
It’s here:
https://pivottable.js.org/examples/local.html
If you want to play along, here’s the whole data file:
https://palinotes.net/grammar/nouns/nyanatusita-table/declension_table-lexicon.csv
Once you cut-and-paste that csv file the pivottable.js.org input box, you can start playing with dragging-and-dropping cell headers around.
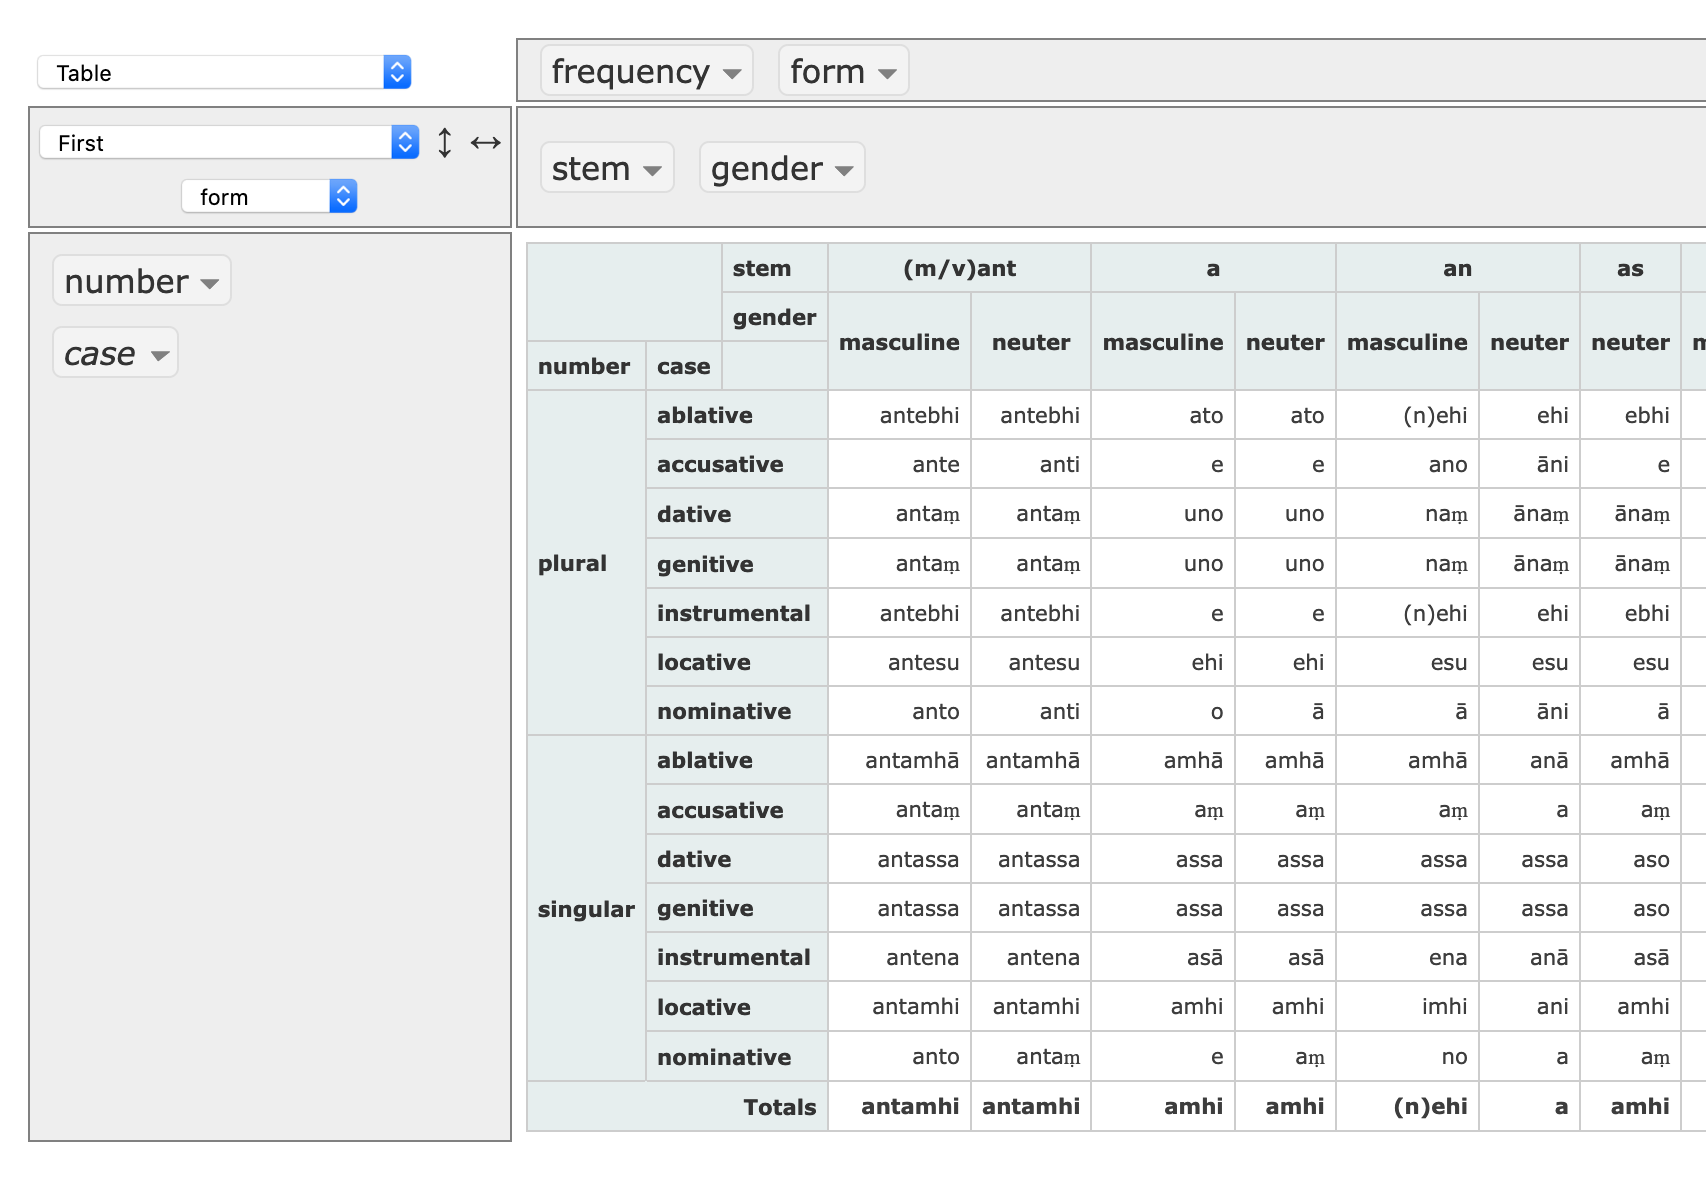
Weirdnesses:
- Totals? What? Obviously that’s intended for numeric data.
- Sorting seems to be strictly alphabetical, which isn’t right in our world (there are conventional orderings of cases, for instance.)
- (This is a serious problem) — only one form per cell is being rendered.
Still, there is a fair amount that’s right here: especially the fact that the “nesting” of attributes seems to be right. For instance, it so happens that the “stem” (not a very good term, come to think of it) -as is always neuter gender. And in fact only the neuter column is rendered — you don’t see empty columns for -as masculine and -as feminine.
Here’s what a single row in the configuration above works out to in the generated HTML:
<tr>
	<th class="pvtRowLabel" rowspan="2">ablative</th>
	<th class="pvtRowLabel" rowspan="1" colspan="2">plural</th>
	<td class="pvtVal row0 col0" data-value="antebhi">antebhi</td>
	<td class="pvtVal row0 col1" data-value="antebhi">antebhi</td>
	<td class="pvtVal row0 col2" data-value="ato">ato</td>
<!-- more cells here…-->
	<td class="pvtVal row0 col19" data-value="ūbhi">ūbhi</td>
	<td class="pvtVal row0 col20" data-value="ūbhi">ūbhi</td>
	<td class="pvtTotal rowTotal" data-value="(n)ehi" data-for="row0">(n)ehi</td>
</tr>
What’s interesting to me is that this markup is pretty much deleting all of the relevant data. The line:
<td class="pvtVal row0 col11" data-value="ūbhi">ūbhi</td>
…“marks up” precisely nothing about the features of the data. In other words, it could have been marked up with relevant information in there:
<td data-gender="feminine" data-number="singular" data-frequency="normal" data-case="ablative" data-form="ūbhi" stem="u">ūbhi</td>
(data attributes are a convenient way to embed arbitrary data into HTML.) Once that data is “in” the table, it becomes possible to do all sorts of things: highlight all forms with data-gender=feminine , say, or simply hide any form with a data-frequency=rare.
I do think it’s a pretty instructive exercise to try dragging the headings around and seeing what happens.
I imagine there are pivot table whizzes among you who can already do this in Excel — it would be great to hear about that!